 Lurra
Before you buy rural land, look at what lies beneath the listing.
Draw the plot on the map, anywhere in the world. In a minute you see what public maps and satellites say about it: whether it may flood, whether it is protected, how steep it is and what has happened to it since 2017.
Any plot in the world. In Spain, a full report with official data.
- Copernicus satellite images and flood model
- Protected Planet protected areas
- OpenStreetMap maps and place names
- In Spain: Catastro, SIGPAC, MITECO and IGN
Preparing the report…
A real example
This is what a report looks like
An 8-hectare irrigated parcel on the floodplain of the river Ebro, in Zaragoza (Spain). On paper, good land. This is what came out when we looked it up:
- 15 % of the land lies inside the 10-year flood zone.
- All of it lies inside the 100-year and 500-year flood zones.
- No protected area over the parcel.
- Two vegetation drops since 2017, both already recovered.
Lurra · Land report
Polygon 204, parcel 276
Soto de Alfocea, Zaragoza · 80,200 m² (8.02 ha)
Red: serious constraints to check
3 points worth clarifying; details in section 7.
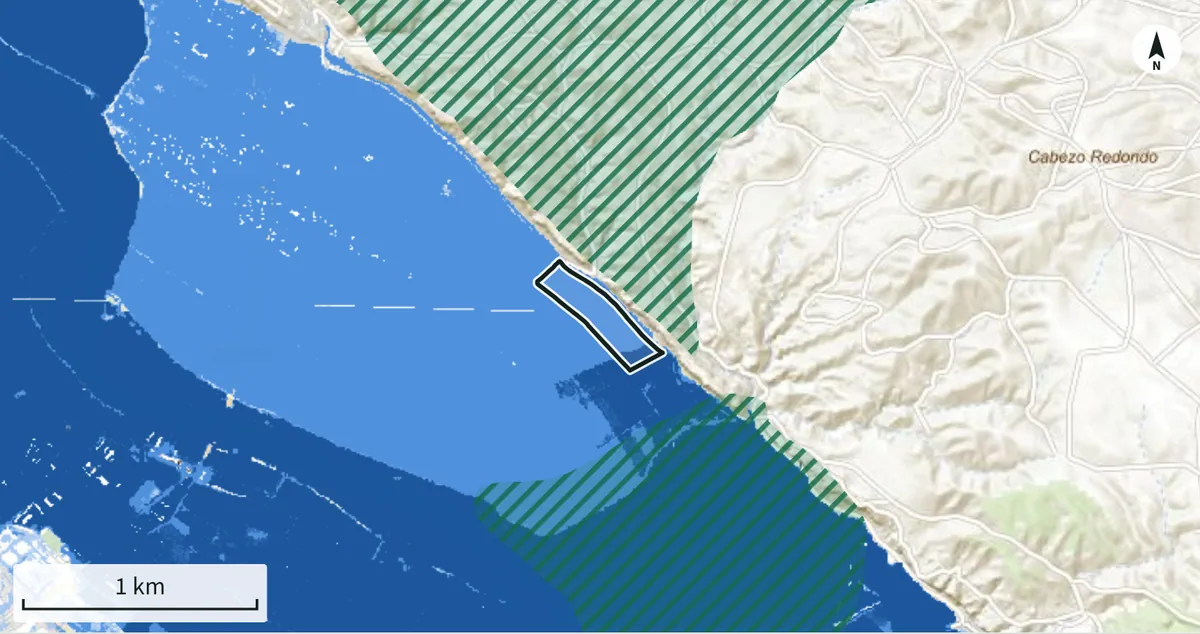
Flood zones (blue) and protected areas (green hatching) around the parcel.
Vegetation vigour (NDVI) month by month, 2017 to 2026. In red, the two drops.
Contents
What the report contains
Seven sections, in the order you should read them. Every figure carries its source and date.
Plot data
Area, perimeter and location of the plot you marked. In Spain, also the cadastral record: use, crops and cadastral area.
Terrain
Elevation, mean and maximum slope, share of the land steeper than 20 % and aspect, from a global terrain model (a 5 m national model in Spain).
Water
A first indication of river flooding from a global 100-year flood model. In Spain, the area inside the official 10, 100 and 500-year flood zones, river and coastal.
Environmental protection
Protected areas that touch the land, with their name and the area affected, from the Protected Planet world database (Natura 2000 and the official inventory in Spain).
Land cover
What covers the land (crops, trees, rangeland, built area) according to a global 10 m map. In Spain, the official SIGPAC land use.
Satellite history
Vegetation vigour month by month since 2017 from Sentinel-2, and the sharp drops that point to felling, fire or building work.
Summary and questions
A traffic-light summary and the list of questions to take to the local authority, the land registry and the seller.
GreenRed
How it works
Three steps, no sign-up, no waiting
Mark the plot
Find the place on the map and click on the corners of the plot, or upload a GeoJSON or KML file. In Spain you can also enter the cadastral reference or click the parcel.
Your browser queries the sources
It asks the public services on the spot (Copernicus, Protected Planet and, in Spain, the Catastro, SIGPAC, the Ministry for the Ecological Transition and the National Geographic Institute) and does the maths. No stale copies, and Lurra neither receives nor stores the plot you look up.
Read the traffic light and keep it
The summary and the sections appear in seconds; the satellite history takes one or two minutes. Save it as a PDF or download the data.
The whole world, with a full official report in Spain. Draw a plot in any country and you get terrain, land cover, protected areas, a first flood indication and the satellite history. In Spain the report adds the cadastral record, the official flood zones and the SIGPAC land use.
Limits
What this report is not
It is not
- It does not tell you whether you can build: that depends on local planning rules, and you must ask the local authority.
- It is not a valuation or a land survey.
- It does not replace the land registry or the official maps of each country.
It is
- The step before: in a few minutes you know whether the land has an obvious problem.
- The list of what to ask before paying a deposit or hiring a professional.
- An informative, non-binding result.
Questions
Frequently asked questions
Every report ends with its sources and the limits of each one.
Does it work in my country?
Yes. Draw the plot on the map or upload a GeoJSON or KML file: anywhere in the world you get terrain, land cover, protected areas, a first flood indication from a global model and the satellite history. In Spain the report also includes the cadastral data, the official flood zones and the SIGPAC land use.
How much does it cost?
Nothing. The service is in a trial phase and reports are free and unlimited.
How do I mark the plot?
Type the name of the town or place in the search box, zoom in until you recognise the land and click on each corner of the plot; close it by clicking the first point or pressing “Finish”. If you already have the outline as a GeoJSON or KML file, upload it instead.
If the report says the land is not in a flood zone, am I safe?
No. Outside Spain the report uses a global model with cells of about 150 m that only considers large rivers and ignores flood defences, small streams, the sea and heavy rain. It is a first indication: ask the water or river basin authority of the country for the official flood maps. In Spain the report uses the official mapping, which only covers the river reaches that have been studied.
Why does the satellite part take longer?
Because your browser reads, month by month, the piece of each Sentinel-2 image that covers the land: between 80 and 200 MB in total, depending on the area, in one or two minutes. The rest of the report appears in seconds, and you can stop the reading at any time: it starts with the most recent years.
Can I keep the report?
Yes: “Save as PDF or print” makes your browser produce the PDF. You can also download the data.
In which language is the report?
In the language of this page. The names of places, protected areas and official bodies stay as they appear in the original sources.
I am buying land in Spain. Where do I find the cadastral reference?
On the property tax (IBI) receipt, on the deed and on the land registry extract; the seller or the estate agent can give it to you. If you do not have it, open “Pick a parcel (Spain)”, zoom in on the land and click on it.
Got a plot in mind?
Make the report now: it is free, needs no sign-up and takes about a minute.
Make the report